
TowerDesk Graph: How a Connected Building Graph Fixes Repeat Faults
TowerDesk Graph is the connected data layer behind the AI Signal Inbox. Here's what it is, how it works, and why it stops the same fault happening five times.

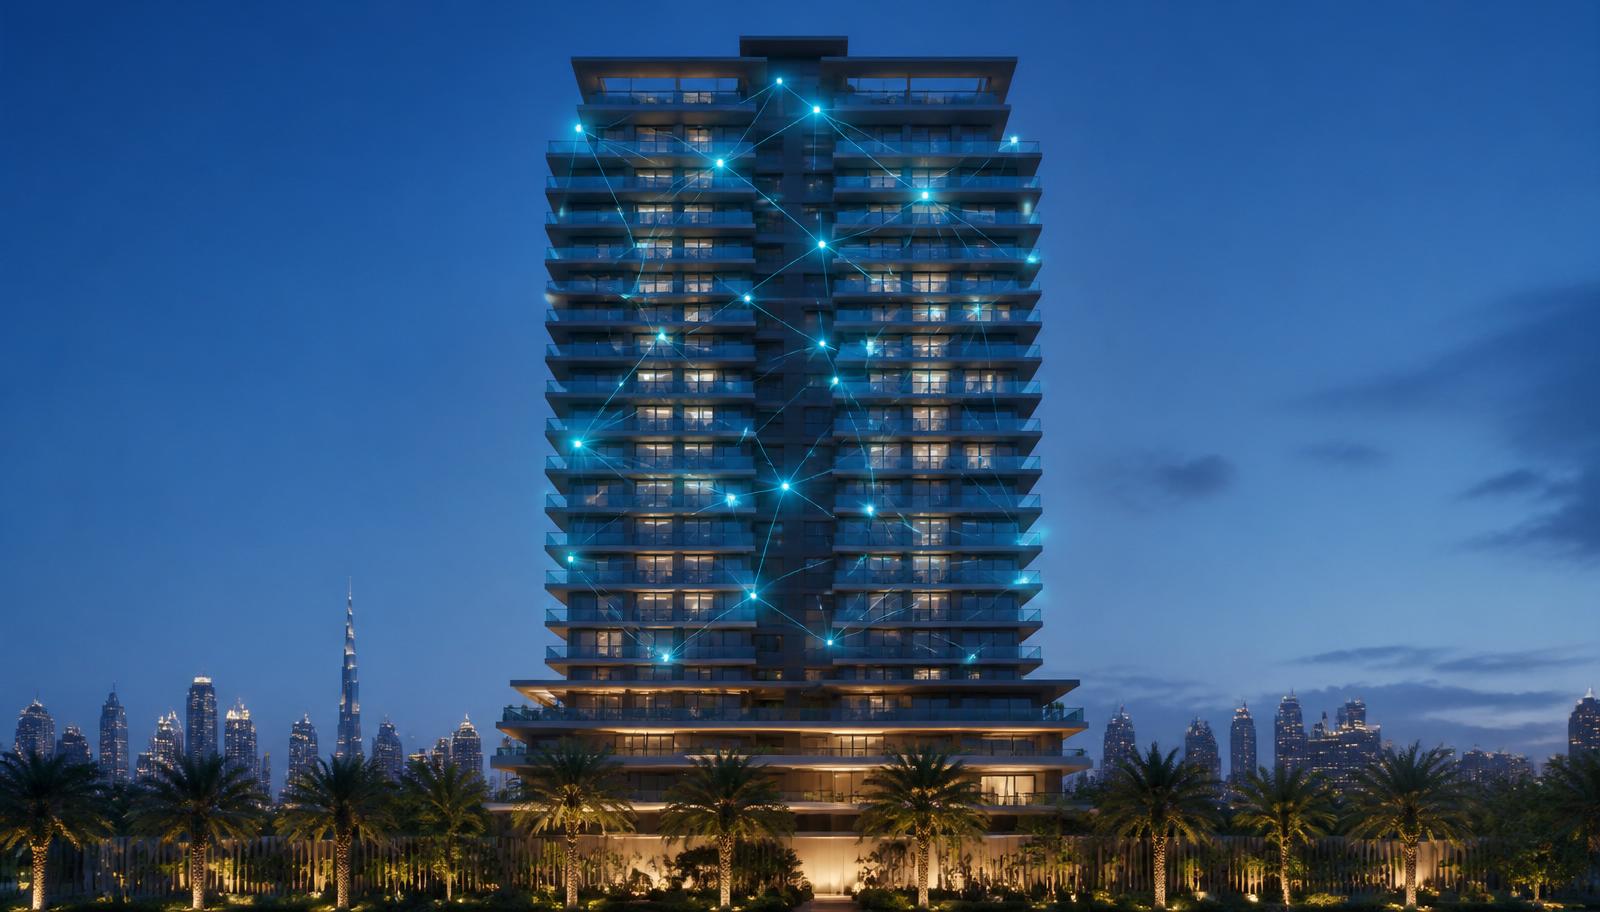
TowerDesk Graph is the connected data layer under every TowerDesk building. It links units, residents, tenants, owners, vendors, assets, and every signal (ticket, invoice, sensor event) into one live map. Combined with the Signal Inbox, it is why repeat faults get fixed once instead of five times.
- The Graph links units, residents, vendors, assets, and signals into one live map.
- It automates root-cause analysis that a database can't — clustering tickets to a shared riser, chiller circuit, or vendor.
- The AI Signal Inbox reads from the Graph to generate weekly action packs.
- Repeat faults typically drop 15%–25% within six months.
- Runs on UAE-region infrastructure, UAE PDPL-compliant.
1. What a knowledge graph is (in one sentence)
A knowledge graph stores every entity in the building (unit, resident, vendor, asset, invoice, ticket) plus every relationship between them, and lets the system reason across the whole network — not just query each entity in isolation.
2. What's in the TowerDesk Graph
- Every unit — owner, tenant, area, chiller circuit, DEWA meter, parking slot, snag history.
- Every resident and owner — identity, verification history, communication preferences, sentiment score.
- Every vendor — trade, licence, insurance, past work orders, ratings.
- Every asset — chiller circuit, lift, AHU, riser, VRF, sensors.
- Every signal — ticket, invoice, sensor reading, gate event, chat message.
- Every relationship — 'this leak is in this riser which serves these units'.
3. Why the graph beats a database
A traditional database stores each entity in a table. Answering 'why do units 306, 406, and 506 all have low water pressure?' requires manual investigation. A graph answers automatically: all three connect to riser #4, which had a valve replaced 90 days ago — root cause candidate is the valve.
4. Repeat-fault clustering in action
- 18 tickets from different units on floors 3–8 → all in the same riser → maintenance targets the riser, not each unit.
- 6 lift-related tickets over 30 days → all in Lift 2 → schedule lift 2 for major service, not individual reactive fixes.
- 12 AC tickets across the tower → all on chiller circuit A → circuit balance issue, not 12 separate AC problems.
5. Sentiment layer
The graph also carries a facility sentiment signal — resident chat, ticket comments, and app ratings are clustered per floor / per amenity / per vendor. Early warning: a rising negative sentiment on floor 12 usually predicts a maintenance failure within 30 days.
6. Weekly action pack
Every Sunday at 8am the OA manager receives a weekly action pack generated from the graph: top 5 repeat faults, top 3 vendor SLA breaches, top 3 sentiment-flagged floors, budget anomalies, and recommended actions. Turns Sunday triage into 15 minutes.
7. Privacy and data residency
The graph runs on UAE-region infrastructure. Personal data is UAE PDPL-compliant. Owners and residents can view their own node in the graph and export their data on request.
8. How to think about the graph as an owner or OA manager
Think of the graph as the tower's memory. Every ticket, invoice, and sensor event feeds it. Every question you ask — 'why do I keep getting this fault?', 'is this vendor really performing?', 'what's driving my chiller bill?' — the graph answers by connecting the dots automatically.
Frequently asked questions
What is TowerDesk Graph?
The connected data layer that stores every unit, resident, vendor, asset, and signal in the building plus every relationship between them — enabling automated root-cause analysis.
How is it different from a normal database?
A database stores each entity in a table and needs manual investigation to link them. A graph stores the relationships as first-class data and answers 'why?' automatically.
What does the weekly action pack contain?
Top repeat faults, vendor SLA breaches, sentiment-flagged floors, budget anomalies, and recommended actions — delivered every Sunday at 8am.
Is the graph UAE PDPL-compliant?
Yes — runs on UAE-region infrastructure, with consent capture and data export on request.
Do owners see the graph?
Owners see their own node — units, invoices, tickets — plus aggregated views like their tower's sentiment and repeat-fault trends.
See TowerDesk in your building
A 30-minute walkthrough on your own portfolio, with RERA, Mollak, Ejari, and DEWA workflows built in.
Book a demoKeep reading
BackAI can spot unauthorised parking, wrong-slot parking, and repeat offenders across a Dubai tower automatically. Here's what's real and what's still marketing.
The gap between 92% and 99% Emirates ID OCR accuracy costs the OA a full-time typist. Here's how the leading platforms benchmark on real UAE IDs.
A plain-English breakdown of Mollak service-charge invoices, master vs sub-community fees, and how to spot overcharging on your annual statement.